Multiple Choice
The graph below shows the velocity versus time graph for a ball. Which explanation best fits the motion of the ball as shown by the graph? 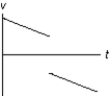
A) The ball is falling, is caught, and is thrown down with greater velocity.
B) The ball is rolling, stops, and then continues rolling.
C) The ball is rising, hits the ceiling, and falls down.
D) The ball is falling, hits the floor, and bounces up.
E) The ball is rising, is caught, and then is thrown down.
Correct Answer:

Verified
Correct Answer:
Verified
Q44: An object is thrown downward with an
Q45: V<sub>x</sub> is the velocity of a particle
Q46: In 20 minutes, Kara ran 2.40 km
Q47: A particle starts from rest at x<sub>i</sub>
Q48: An automobile traveling along a straight road
Q50: At t = 0, a particle is
Q51: A speedy tortoise can run with a
Q52: A problem may be solved more easily
Q53: A 50-gram superball traveling at 25.0 m/s
Q54: Two identical balls are at rest and