Multiple Choice
Exhibit 16-1
The figure below shows a sine wave at one point of a string as a function of time. 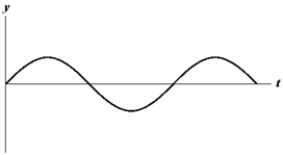 Use the exhibit to answer the following question(s) .
-Refer to Exhibit 16-1. Which of the graphs below shows a wave where the amplitude and the frequency are doubled?
A) 
B) 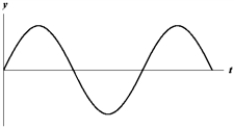
C) 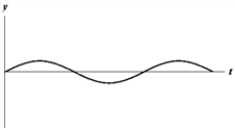
D) 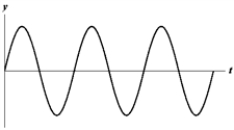
E) 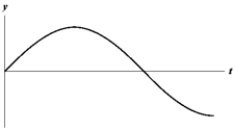
Correct Answer:

Verified
Correct Answer:
Verified
Related Questions
Q44: If y = 0.02 sin (30x −
Q45: The variation in the pressure of helium
Q46: A wave generated in a medium is
Q47: By what factor will an intensity change
Q48: Bats can detect small objects such as
Q50: A point source emits sound waves with
Q51: Calculate the displacement amplitude (in m) of
Q52: The variation in the pressure of helium
Q53: A piano string of density 0.005 0
Q54: Ocean waves with a wavelength of 120