Multiple Choice
Exhibit 16-1
The figure below shows a sine wave at one point of a string as a function of time. 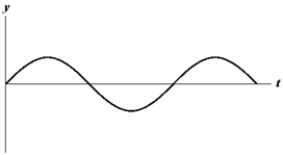 Use the exhibit to answer the following question(s) .
-Refer to Exhibit 16-1. Which of the graphs below shows a wave where the amplitude and frequency are each reduced in half?
A) 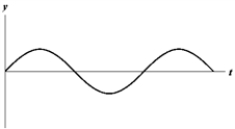
B) 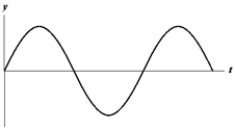
C) 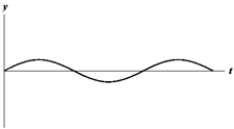
D) 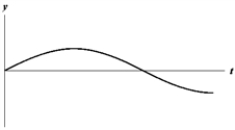
E) 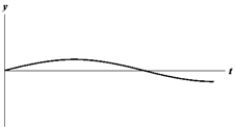
Correct Answer:

Verified
Correct Answer:
Verified
Related Questions
Q23: A sculptor strikes a piece of marble
Q24: An earthquake emits both S-waves and P-waves
Q25: A stone is thrown into a quiet
Q26: The wavelength of light visible to the
Q27: The velocity of sound in sea water
Q29: A piano wire of length 1.5 m
Q30: A spherical wave has the form <img
Q31: The speed of a 10-kHz sound wave
Q32: A friend hands you an equation sheet
Q33: If y = 0.02 sin (30x −