Multiple Choice
Exhibit 10-3
The graph below shows a plot of angular velocity in rad/s versus time in s from t = 0 s to t = 7 s. 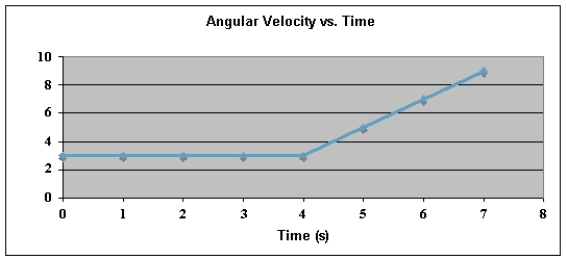 Use this exhibit to answer the following question(s) .
-Refer to Exhibit 10-3. The angular position, θ, at t = 0 s is 3.0 rad, clockwise. The angular position, θ, at t = 7 s is
A) 27 rad, CW.
B) 27 rad, CCW.
C) 33 rad, CW.
D) 33 rad, CCW.
E) 36 rad, CCW.
Correct Answer:

Verified
Correct Answer:
Verified
Q72: The rigid body shown rotates about an
Q73: The angular speed of the hour hand
Q74: A uniform rod (length = 2.0 m)
Q75: Particles (mass of each = 0.40 kg)
Q76: Exhibit 10-3<br>The graph below shows a plot
Q78: The graphs below show angular velocity as
Q79: A uniform meter stick is pivoted to
Q80: A wheel rotates about a fixed axis
Q81: A uniform rod is 2.0 m long.
Q82: A uniform rod (length = 2.4 m)