Multiple Choice
The graph below shows a plot of angular acceleration in rad/s2 versus time from t = 0 s to t = 8 s. The change in angular velocity, Δω, during this 8-second period is 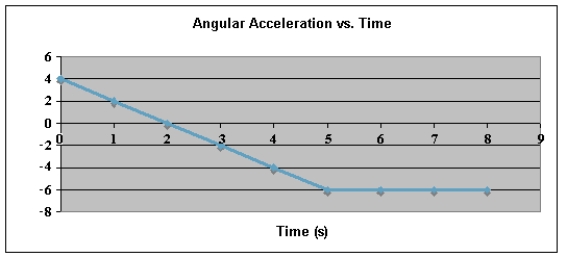
A)  , CW.
, CW.
B)  , CCW.
C)  , CW.
, CW.
D)  , CCW.
E)  , CW.
, CW.
Correct Answer:

Verified
Correct Answer:
Verified
Related Questions
Q32: Two particles (m<sub>1</sub> = 0.20 kg, m<sub>2</sub>
Q33: A uniform rod of length (L =
Q34: A small sphere attached to a light
Q35: A mass m = 4.0 kg is
Q36: A uniform sphere of radius R and
Q38: Four identical particles (mass of each =
Q39: The angular speed of the hour hand
Q40: Three particles, each of which has a
Q41: The figure below shows a graph of
Q42: At t = 0, a wheel rotating