Multiple Choice
A professor of economics at a small Texas university wanted to determine what year in school students were taking his tough economics course.Shown below is a pie chart of the results.What percentage of the class took the course prior to reaching their senior year? 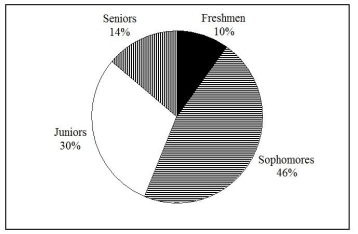
A) 14%
B) 44%
C) 54%
D) 86%
Correct Answer:

Verified
Correct Answer:
Verified
Q41: The relative frequency is the frequency in
Q41: TABLE 2-9<br>The frequency distribution below represents the
Q50: TABLE 2-13<br>Given below is the stem-and-leaf display
Q78: A_ is a summary table in which
Q80: SCENARIO 2-1<br>An insurance company evaluates many numerical
Q93: A_ is a vertical bar chart in
Q126: TABLE 2-18<br>The stem-and-leaf display below shows the
Q178: You have collected data on the responses
Q202: TABLE 2-10<br>The histogram below represents scores achieved
Q203: TABLE 2-14<br>The table below contains the number