Short Answer
TABLE 2-9
The frequency distribution below represents the rents of 250 randomly selected federally subsidized apartments in a small town.
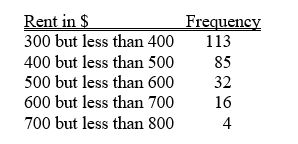
-Referring to Table 2-9, the class midpoint of the second class is ________.
Correct Answer:

Verified
Correct Answer:
Verified
Q10: In graphing two categorical data,the side-by-side bar
Q58: The main principle behind the Pareto chart
Q60: The original data values cannot be determined
Q130: Determining the class boundaries of a frequency
Q202: TABLE 2-10<br>The histogram below represents scores achieved
Q203: TABLE 2-14<br>The table below contains the number
Q204: TABLE 2-8<br>The Stem-and-Leaf display represents the number
Q205: TABLE 2-14<br>The table below contains the number
Q206: TABLE 2-2<br>At a meeting of information systems
Q207: TABLE 2-7<br>The Stem-and-Leaf display below contains data