menu-iconExamlexExamLexServices

Discover

Ask a Question
  1. All Topics
  2. Topic
    Statistics
  3. Study Set
    Basic Business Statistics
  4. Exam
    Exam 2: Organizing and Visualizing Data
  5. Question
    Given Below Is the Scatter Plot of the Market Value
Solved

Given Below Is the Scatter Plot of the Market Value

Question 109

Question 109

True/False

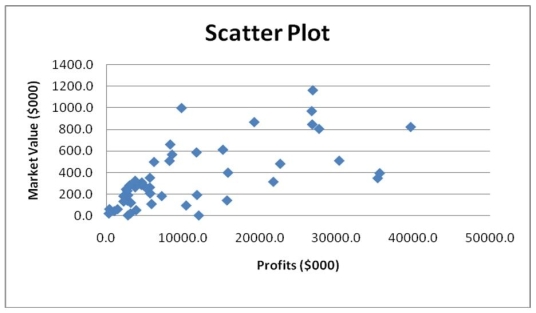
Given below is the scatter plot of the market value (thousands$)and profit (thousands$)of 50 U.S.companies.Higher market values appear to be associated with higher profits.

Correct Answer:

verifed

Verified

Unlock this answer now
Get Access to more Verified Answers free of charge

Related Questions

Q17: When studying the simultaneous responses to two

Q19: In a contingency table,the number of rows

Q43: The stem-and-leaf display is often superior to

Q71: TABLE 2-11<br>The ordered array below resulted from

Q72: You have collected information on the market

Q78: TABLE 2-8<br>The Stem-and-Leaf display represents the number

Q118: A histogram can have gaps between the

Q135: You have collected data on the number

Q158: Histograms are used for numerical data while

Q206: TABLE 2-2<br>At a meeting of information systems

Examlex

ExamLex

About UsContact UsPerks CenterHomeschoolingTest Prep

Work With Us

Campus RepresentativeInfluencers

Links

FaqPricingChrome Extension

Download The App

Get App StoreGet Google Play

Policies

Privacy PolicyTerms of ServiceHonor CodeCommunity Guidelines

Scan To Download

qr-code

Copyright © (2025) ExamLex LLC.

Privacy PolicyTerms Of ServiceHonor CodeCommunity Guidelines