menu-iconExamlexExamLexServices

Discover

Ask a Question
  1. All Topics
  2. Topic
    Statistics
  3. Study Set
    Basic Business Statistics
  4. Exam
    Exam 2: Organizing and Visualizing Data
  5. Question
    Given Below Is the Scatter Plot of the Market Value
Solved

Given Below Is the Scatter Plot of the Market Value

Question 29

Question 29

True/False

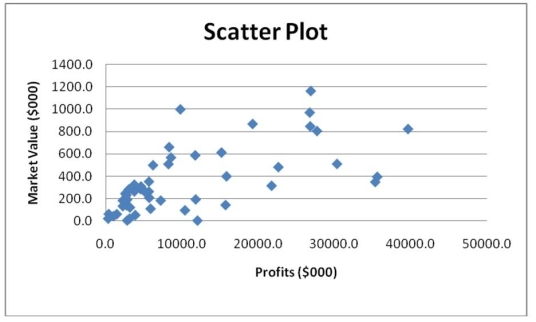
Given below is the scatter plot of the market value (thousands$)and profit (thousands$)of 50 U.S.companies.There appears to be a negative relationship between market value and profit.

Correct Answer:

verifed

Verified

Unlock this answer now
Get Access to more Verified Answers free of charge

Related Questions

Q8: TABLE 2-16<br>The figure below is the percentage

Q19: TABLE 2-13<br>Given below is the stem-and-leaf display

Q25: It is essential that each class grouping

Q36: TABLE 2-12<br>The table below contains the opinions

Q40: TABLE 2-11<br>The ordered array below resulted from

Q64: When polygons or histograms are constructed,which axis

Q69: TABLE 2-7<br>The Stem-and-Leaf display below contains data

Q95: TABLE 2-5<br>The following are the duration in

Q114: TABLE 2-4<br>A survey was conducted to determine

Q174: A Wal-Mart store in a small town

Examlex

ExamLex

About UsContact UsPerks CenterHomeschoolingTest Prep

Work With Us

Campus RepresentativeInfluencers

Links

FaqPricingChrome Extension

Download The App

Get App StoreGet Google Play

Policies

Privacy PolicyTerms of ServiceHonor CodeCommunity Guidelines

Scan To Download

qr-code

Copyright © (2025) ExamLex LLC.

Privacy PolicyTerms Of ServiceHonor CodeCommunity Guidelines