menu-iconExamlexExamLexServices

Discover

Ask a Question
  1. All Topics
  2. Topic
    Statistics
  3. Study Set
    Basic Business Statistics
  4. Exam
    Exam 2: Organizing and Visualizing Data
  5. Question
    Given Below Is the Scatter Plot of the Number of Employees
Solved

Given Below Is the Scatter Plot of the Number of Employees

Question 100

Question 100

True/False

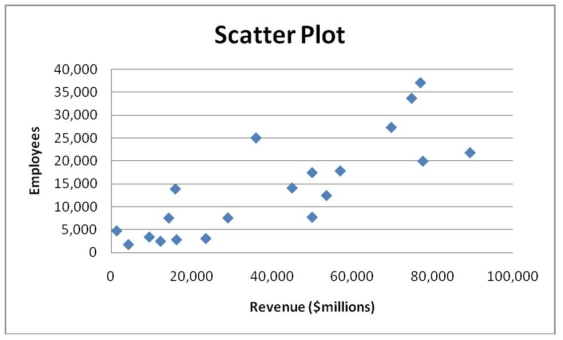
Given below is the scatter plot of the number of employees and the total revenue ($millions)of 20 U.S.companies.There appears to be a positive relationship between total revenue and the number of employees.

Correct Answer:

verifed

Verified

Unlock this answer now
Get Access to more Verified Answers free of charge

Related Questions

Q1: TABLE 2-7<br>The Stem-and-Leaf display below contains data

Q17: When studying the simultaneous responses to two

Q20: You have collected data on the approximate

Q63: One of the developing countries is experiencing

Q75: TABLE 2-14<br>The table below contains the number

Q101: Given below is the scatter plot of

Q164: TABLE 2-14<br>The table below contains the number

Q181: The personnel director at a large company

Q193: TABLE 2-13<br>Given below is the stem-and-leaf display

Q206: TABLE 2-2<br>At a meeting of information systems

Examlex

ExamLex

About UsContact UsPerks CenterHomeschoolingTest Prep

Work With Us

Campus RepresentativeInfluencers

Links

FaqPricingChrome Extension

Download The App

Get App StoreGet Google Play

Policies

Privacy PolicyTerms of ServiceHonor CodeCommunity Guidelines

Scan To Download

qr-code

Copyright © (2025) ExamLex LLC.

Privacy PolicyTerms Of ServiceHonor CodeCommunity Guidelines