Multiple Choice
TABLE 14-4
A real estate builder wishes to determine how house size (House) is influenced by family income (Income) , family size (Size) , and education of the head of household (School) . House size is measured in hundreds of square feet, income is measured in thousands of dollars, and education is in years. The builder randomly selected 50 families and ran the multiple regression. Microsoft Excel output is provided below: 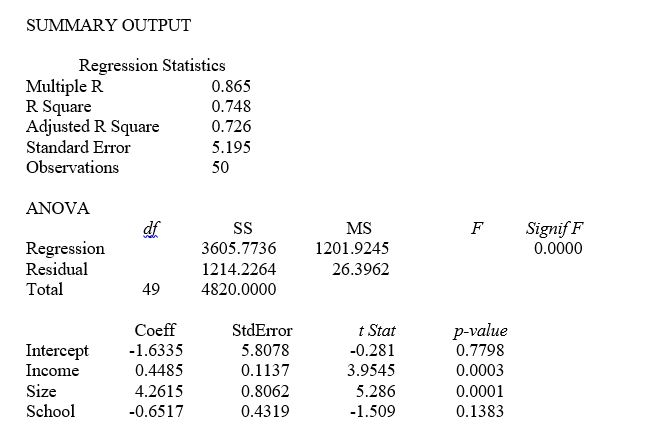
-Referring to Table 14-4, when the builder used a simple linear regression model with house size (House) as the dependent variable and education (School) as the independent variable, he obtained an r² value of 23.0%. What additional percentage of the total variation in house size has been explained by including family size and income in the multiple regression?
A) 2.8%
B) 51.8%
C) 72.6%
D) 74.8%
Correct Answer:

Verified
Correct Answer:
Verified
Q190: TABLE 14-17<br> <img src="https://d2lvgg3v3hfg70.cloudfront.net/TB1602/.jpg" alt="TABLE 14-17
Q191: TABLE 14-10<br>You worked as an intern at
Q192: TABLE 14-3<br>An economist is interested to see
Q193: TABLE 14-18<br>A logistic regression model was estimated
Q194: TABLE 14-17<br> <img src="https://d2lvgg3v3hfg70.cloudfront.net/TB1602/.jpg" alt="TABLE 14-17
Q196: TABLE 14-15<br>The superintendent of a school district
Q197: TABLE 14-16<br>What are the factors that determine
Q198: TABLE 14-15<br>The superintendent of a school district
Q199: TABLE 14-15<br>The superintendent of a school district
Q200: TABLE 14-17<br> <img src="https://d2lvgg3v3hfg70.cloudfront.net/TB1602/.jpg" alt="TABLE 14-17