Multiple Choice
TABLE 17-3
A quality control analyst for a light bulb manufacturer is concerned that the time it takes to produce a batch of light bulbs is too erratic.Accordingly,the analyst randomly surveys 10 production periods each day for 14 days and records the sample mean and range for each day.
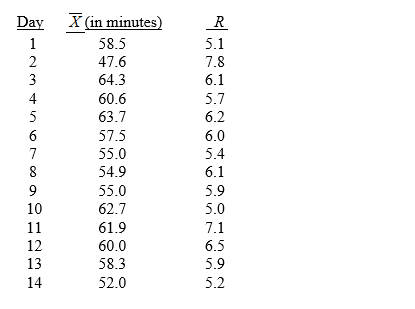
-Referring to Table 17-3,suppose the analyst constructs an  chart to see if the production process is in-control.What is the upper control limit (UCL) for this chart?
A) 62.15
B) 60.95
C) 59.85
D) 58.75
Correct Answer:

Verified
Correct Answer:
Verified
Q19: A process capability is estimated by the
Q38: Referring to Table 17-4, what percentage of
Q53: Common causes of variation are correctable without
Q63: The CPL and CPU indexes are used
Q73: Common causes of variation represent variation due
Q100: Referring to Table 17-7, what is the
Q114: TABLE 17-10<br>Below is the number of defective
Q120: Referring to Table 17-4, what is the
Q124: TABLE 17-7<br>A supplier of silicone sheets for
Q127: TABLE 17-7<br>A supplier of silicone sheets for