Multiple Choice
TABLE 17-4
A factory supervisor is concerned that the time it takes workers to complete an important production task (measured in seconds) is too erratic and adversely affects expected profits.The supervisor proceeds by randomly sampling 5 individuals per hour for a period of 10 hours.The sample mean and range for each hour are listed below.
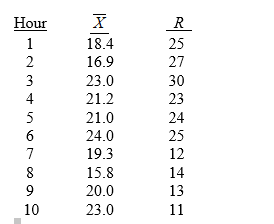
She also decides that lower and upper specification limit for the critical-to-quality variable should be 10 and 30 seconds, respectively.
-Referring to Table 17-4,suppose the supervisor constructs an  chart to see if the process is in-control.What are the lower and upper control limits of this chart?
A) 10.00,30.00
B) 8.49,32.03
C) 5.39,35.13
D) 4.96,35.56
Correct Answer:

Verified
Correct Answer:
Verified
Q6: TABLE 17-7<br>A supplier of silicone sheets for
Q9: TABLE 17-9<br>The manufacturer of canned food constructed
Q12: Determining the root causes of why defects
Q43: TABLE 17-1<br>A local newspaper has 10 delivery
Q45: TABLE 17-10<br>Below is the number of defective
Q61: The Cp index measures the potential of
Q89: TABLE 17-7<br>A supplier of silicone sheets for
Q102: Cpk > 1 indicates that the process
Q105: TABLE 17-8<br>Recently, a university switched to a
Q142: Which of the following is not part