Multiple Choice
TABLE 17-4
A factory supervisor is concerned that the time it takes workers to complete an important production task (measured in seconds) is too erratic and adversely affects expected profits.The supervisor proceeds by randomly sampling 5 individuals per hour for a period of 10 hours.The sample mean and range for each hour are listed below.
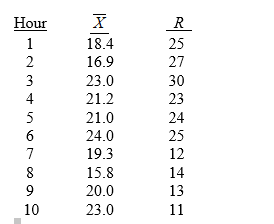
She also decides that lower and upper specification limit for the critical-to-quality variable should be 10 and 30 seconds, respectively.
-Referring to Table 17-4,suppose the supervisor constructs an  chart to see if the process is in-control.Which expression best describes this chart?
A) Decreasing trend
B) In-control
C) Increasing trend
D) Individual outliers
Correct Answer:

Verified
Correct Answer:
Verified
Q22: In the United States,the control limits on
Q24: TABLE 17-5<br>A manufacturer of computer disks took
Q36: The cause of variation that can be
Q40: TABLE 17-8<br>Recently,a university switched to a new
Q42: TABLE 17-8<br>Recently,a university switched to a new
Q60: TABLE 17-1<br>A local newspaper has 10 delivery
Q71: The Shewhart-Deming cycle plays an important role
Q119: TABLE 17-3<br>A quality control analyst for a
Q128: Cp > 1 indicates that if the
Q155: Which of the following is not part