Multiple Choice
Electric field and potential : The graph in the figure shows the variation of the electric potential V (measured in volts) as a function of the radial direction r (measured in meters) . For which range or value of r is the magnitude of the electric field the largest? 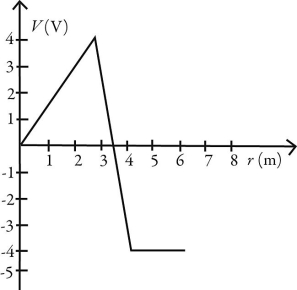
A) from r = 0 m to r = 3 m
B) from r = 3 m to r = 4 m
C) from r = 4 m to r = 6 m
D) at r = 3 m
E) at r = 4 m
Correct Answer:

Verified
Correct Answer:
Verified
Q6: Potential energy of point-charges: The figure shows
Q7: Potential energy of point-charges: Suppose you have
Q8: Spheres of charge: A conducting sphere of
Q9: Potential due to point-charges: Three point charges
Q10: Potential energy of point-charges: Consider the group
Q12: Lines of charge: Two long conducting cylindrical
Q13: Parallel plates: Two parallel conducting plates are
Q14: Potential due to point-charges: The figure shows
Q15: Spheres of charge: A nonconducting sphere contains
Q16: Potential due to point-charges: Four equal +6.00-μC