Essay
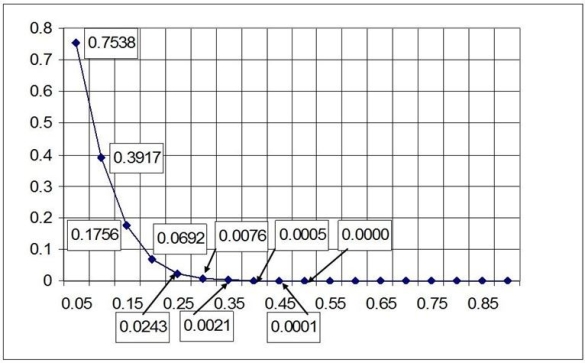
This OC curve represents a single sampling plan conducted on a lot size of 200 with a sample size of 20 and an acceptance number of 1. The y-coordinates of the first few points have been labeled; the x coordinates appear on the x-axis. If the receiving company uses rectified inspection, what is the greatest fraction defective that will enter their production process?
Correct Answer:

Verified
Average outgoing quality is calculated a...View Answer
Unlock this answer now
Get Access to more Verified Answers free of charge
Correct Answer:
Verified
View Answer
Unlock this answer now
Get Access to more Verified Answers free of charge
Q34: An item is purchased with one surface
Q35: Increasing c while holding n constant decreases
Q36: A double-sampling plan has a lower _
Q37: A single-sampling plan using a sample size
Q38: A sample of 100 items is randomly
Q40: A(n) _ is when the consumer randomly
Q41: A double-sampling plan has n₁ = 50,
Q42: A rectified inspection plan requires that:<br>A) a
Q43: A small _ can be disregarded in
Q44: What is the basic idea of incoming