Essay
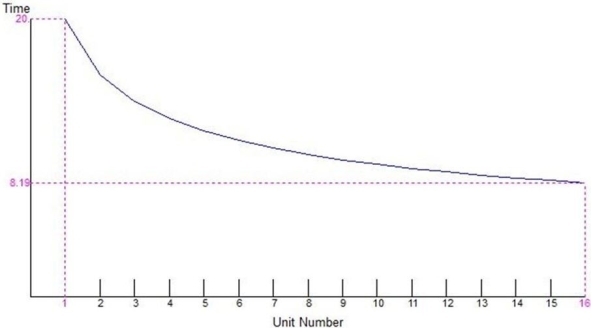
The labor time for successive units produced is plotted in the graph shown below. What is the learning percentage reflected by this graph?
Correct Answer:

Verified
The first unit takes 20 units of time an...View Answer
Unlock this answer now
Get Access to more Verified Answers free of charge
Correct Answer:
Verified
The first unit takes 20 units of time an...
View Answer
Unlock this answer now
Get Access to more Verified Answers free of charge
Related Questions
Q53: Customer involvement reflects the ways in which
Q54: The authors list six key elements of
Q55: Scenario 2.6<br>You currently purchase a part used
Q56: _ is the mix of equipment and
Q57: Highly customized job processes and processes that
Q59: A job process has the highest level
Q60: The learning curve for a process depends
Q61: Which one of the following statements concerning
Q62: Scenario 2.5<br>A job consists of three distinct
Q63: Scenario 2.5<br>A job consists of three distinct