Multiple Choice
Table 5.11
Factors for Calculating Three-Sigma Limits for the
Chart and R-Chart
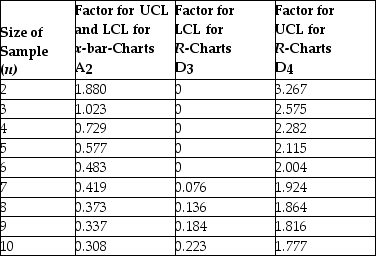
Source: 1950 ASTM Manual on Quality Control of Materials, copyright American Society for Testing Materials. Reprinted with permission.
-Thermostats are subjected to rigorous testing before they are shipped to air conditioning technicians around the world. Results from the last five samples are shown in the table. Create control charts that will fully monitor the process and indicate the result of X-bar and R-chart analysis. 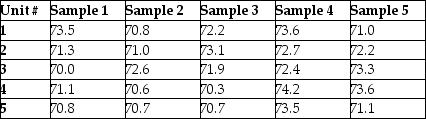
A) x bar and r chart are both out of control
B) x bar chart is in control but r chart is out of control
C) x bar chart is out of control but r chart is in control
D) x bar and r chart are both in control
Correct Answer:

Verified
Correct Answer:
Verified
Q188: While acceptance sampling does determine if incoming
Q189: Which one of the following is part
Q190: The poultry farmer was aghast when the
Q191: Use the data in Table 5.4. What
Q192: In SPC, the distribution of sample means:<br>A)
Q193: The upper and lower specification limits for
Q195: _ of variation are the purely random,
Q196: Among the seven criteria in the Baldrige
Q197: When considering the plan-do-study-act cycle for problem
Q198: What is the difference between the Cp