Multiple Choice
Table 5.11
Factors for Calculating Three-Sigma Limits for the
Chart and R-Chart
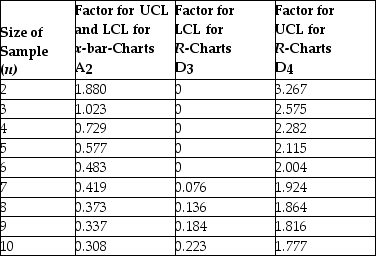
Source: 1950 ASTM Manual on Quality Control of Materials, copyright American Society for Testing Materials. Reprinted with permission.
-Construct a 3-sigma x-bar chart for the length in centimeters of a part from the following table. What is the upper control limit? 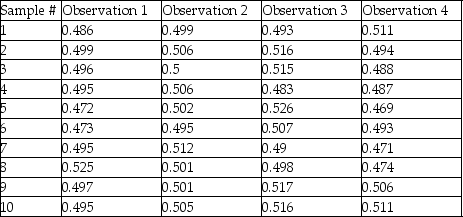
A) 0.522
B) 0.509
C) 0.496
D) 0.475
Correct Answer:

Verified
Correct Answer:
Verified
Q136: Defects are caught and corrected where they
Q137: In Statistical Process Control, _ are used
Q138: The upper and lower specifications for a
Q139: Which one of the following statements relating
Q140: Which of the following would be considered
Q142: An acceptable quality level is measured as
Q143: Which one of the following statements is
Q144: From an ethical standpoint, it is not
Q145: On a control chart, a type I
Q146: As he entered his broker's office for