Multiple Choice
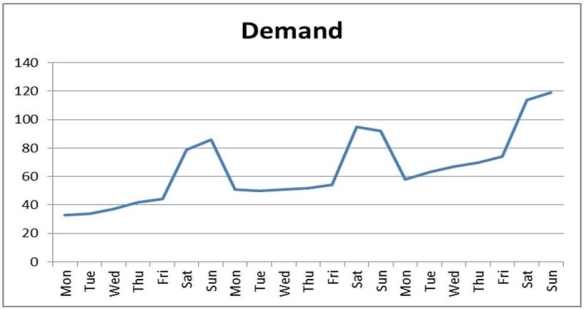
Graph 8.1
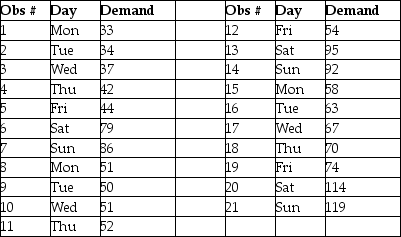
Data plotted in the graph appear in the table below.


-Refer to Graph 8.1. What is the average demand for the second period?
A) 63.57
B) 50.71
C) 82.5
D) 93.5
Correct Answer:

Verified
Correct Answer:
Verified
Q125: Table 8.5<br> <img src="https://d2lvgg3v3hfg70.cloudfront.net/TB1252/.jpg" alt="Table 8.5
Q126: Table 8.1<br>The management of an insurance company
Q127: Table 8.5<br> <img src="https://d2lvgg3v3hfg70.cloudfront.net/TB1252/.jpg" alt="Table 8.5
Q128: Combination forecasting is most effective when the
Q129: The trend projection with regression model can
Q131: Which one of the following statements about
Q132: Calculate three forecasts using the following data.
Q133: Table 8.1<br>The management of an insurance company
Q134: The Delphi method of forecasting is useful
Q135: A weary traveler shows up at a