menu-iconExamlexExamLexServices

Discover

Ask a Question
  1. All Topics
  2. Topic
    Business
  3. Study Set
    Operations Management Processes
  4. Exam
    Exam 8: Forecasting
  5. Question
    Graph 8.1 Data Plotted in the Graph Appear in the Table Below
Solved

Graph 8.1 Data Plotted in the Graph Appear in the Table Below

Question 72

Question 72

Multiple Choice

Graph 8.1
Data plotted in the graph appear in the table below.
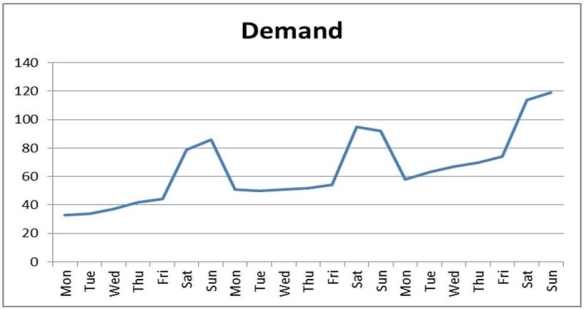
Graph 8.1 Data plotted in the graph appear in the table below.        -Refer to Graph 8.1. What is the average seasonal index for the Sundays in the data set? A)  0.65 B)  0.67 C)  1.49 D)  1.54
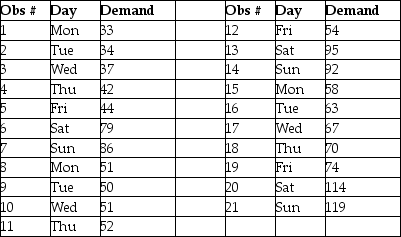
-Refer to Graph 8.1. What is the average seasonal index for the Sundays in the data set?


A) 0.65
B) 0.67
C) 1.49
D) 1.54

Correct Answer:

verifed

Verified

Unlock this answer now
Get Access to more Verified Answers free of charge

Related Questions

Q67: Judgment methods of forecasting should never be

Q68: Table 8.7<br>A sales manager wants to forecast

Q69: One of the basic time series patterns

Q70: Judgment methods of forecasting are quantitative methods

Q71: A regression equation with a coefficient of

Q73: Table 8.2<br>The Agricultural Extension Agent's Office has

Q74: Market research is a systematic approach to

Q75: When forecasting total demand for all their

Q76: Which one of the following is most

Q77: Table 8.4<br>The Furniture Super Mart is a

Examlex

ExamLex

About UsContact UsPerks CenterHomeschoolingTest Prep

Work With Us

Campus RepresentativeInfluencers

Links

FaqPricingChrome Extension

Download The App

Get App StoreGet Google Play

Policies

Privacy PolicyTerms of ServiceHonor CodeCommunity Guidelines

Scan To Download

qr-code

Copyright © (2025) ExamLex LLC.

Privacy PolicyTerms Of ServiceHonor CodeCommunity Guidelines