Multiple Choice
Table 8.9
Consider the following results from the last ten periods of student enrollment forecast by the Operations Management department chairman.
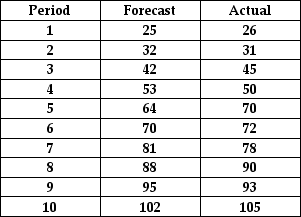
-Use Table 8.9 to determine the cumulative sum of forecast errors as of period 6 for the department chairman's forecast.
A) -10
B) -6
C) -8
D) -4
Correct Answer:

Verified
Correct Answer:
Verified
Q95: Professor Willis noted that the popularity of
Q96: Describe the combination forecast techniques and discuss
Q97: A(n) _ measures the direction and strength
Q98: _ is a causal method of forecasting
Q99: Table 8.7<br>A sales manager wants to forecast
Q101: Table 8.7<br>A sales manager wants to forecast
Q102: A weary traveler shows up at a
Q103: Table 8.5<br> <img src="https://d2lvgg3v3hfg70.cloudfront.net/TB1252/.jpg" alt="Table 8.5
Q104: The _ measures the amount of variation
Q105: Table 8.9<br>Consider the following results from the