Short Answer
A paired-difference experiment was conducted to compare two populations. The data are shown in the table. Use a sign test to determine whether the population distributions are different. 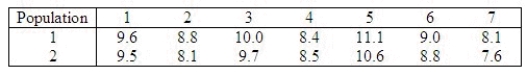 The null and alternate hypotheses are as follows:
  Determine an appropriate rejection region with
  0.01.
0.01.
Critical Values: ______________ Enter n1, n2
Calculate the observed value of the test statistic.
______________
Conclude: ______________
The data present ______________ evidence to indicate that populations 1 and 2 are different.
Correct Answer:

Verified
0,7; 6; Do not rejec...View Answer
Unlock this answer now
Get Access to more Verified Answers free of charge
Correct Answer:
Verified
View Answer
Unlock this answer now
Get Access to more Verified Answers free of charge
Q175: In a Wilcoxon rank sum test, the
Q176: The reaction times to three stimuli were
Q177: In a normal approximation to the Wilcoxon
Q178: Which of the following correctly describes the
Q179: Which of the following tests employs matched-pairs
Q181: The statistical methods discussed in this chapter
Q182: The Friedman test is employed to compare
Q183: In a normal approximation to the Wilcoxon
Q184: Two gourmets, A and B, rated 22
Q185: A nonparametric method to compare two or