Short Answer
In an investigation of the visual scanning behavior of deaf children, measurements of eye movement rates were taken on nine deaf and nine hearing children as shown in the table below. 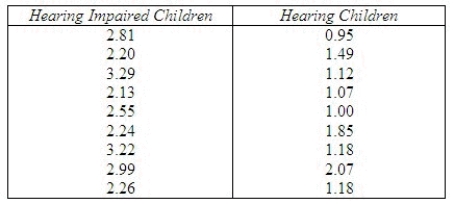 Does it appear that the distributions of eye-movement rates for deaf children and hearing children differ? Test at
  = 0.05 using the Wilcoxon rank sum test.
The null and alternate hypotheses are:  : The distributions of eye-movement rates for hearing impaired children and hearing children are identical.
  : The distributions of eye-movement rates for hearing impaired children and hearing children are different.
What is the test statistic?
T: ______________
What is the critical value for the test statistic?
______________
Thus: ______________
Conclude:
We conclude that the hearing impaired children ______________ from the hearing children in eye-movement rate.
Correct Answer:

Verified
Correct Answer:
Verified
Q1: A two-independent sample t-test corresponds to a
Q2: If the Friedman test is applied to
Q4: Nonparametric tests are methods of inference that
Q5: Two aptitude tests are currently being used
Q6: The nonparametric counterpart of the parametric t-test
Q7: You are performing the Wilcoxon rank-sum test.
Q8: A car dealer was interested in comparing
Q9: If the Friedman test is applied to
Q10: A nonparametric method to compare two or
Q11: The nonparametric counterpart of the parametric one-way