Solved

A Survey of 500 Respondents Produced These Cell Counts in a 2

Question 33

Short Answer

A survey of 500 respondents produced these cell counts in a 2 A survey of 500 respondents produced these cell counts in a 2   3 contingency table:   If you wish to test the null hypothesis of  independence  - that the probability that a response falls in any one row is independent of the column it falls in - and you plan to use a chi-square test, how many degrees of freedom will be associated with the   statistic? df = ______________ Compute   : = ______________ Reject   when   > ______________. Conclude that there ______________ reason to expect a dependence between rows and columns. Find the approximate p-value for the test. The p-value ______________ .10 3 contingency table: A survey of 500 respondents produced these cell counts in a 2   3 contingency table:   If you wish to test the null hypothesis of  independence  - that the probability that a response falls in any one row is independent of the column it falls in - and you plan to use a chi-square test, how many degrees of freedom will be associated with the   statistic? df = ______________ Compute   : = ______________ Reject   when   > ______________. Conclude that there ______________ reason to expect a dependence between rows and columns. Find the approximate p-value for the test. The p-value ______________ .10 
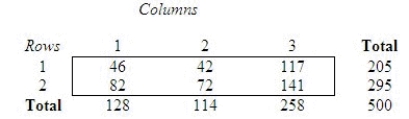
If you wish to test the null hypothesis of "independence" - that the probability that a response falls in any one row is independent of the column it falls in - and you plan to use a chi-square test, how many degrees of freedom will be associated with the A survey of 500 respondents produced these cell counts in a 2   3 contingency table:   If you wish to test the null hypothesis of  independence  - that the probability that a response falls in any one row is independent of the column it falls in - and you plan to use a chi-square test, how many degrees of freedom will be associated with the   statistic? df = ______________ Compute   : = ______________ Reject   when   > ______________. Conclude that there ______________ reason to expect a dependence between rows and columns. Find the approximate p-value for the test. The p-value ______________ .10 statistic?
df = ______________
Compute A survey of 500 respondents produced these cell counts in a 2   3 contingency table:   If you wish to test the null hypothesis of  independence  - that the probability that a response falls in any one row is independent of the column it falls in - and you plan to use a chi-square test, how many degrees of freedom will be associated with the   statistic? df = ______________ Compute   : = ______________ Reject   when   > ______________. Conclude that there ______________ reason to expect a dependence between rows and columns. Find the approximate p-value for the test. The p-value ______________ .10 : = ______________
Reject A survey of 500 respondents produced these cell counts in a 2   3 contingency table:   If you wish to test the null hypothesis of  independence  - that the probability that a response falls in any one row is independent of the column it falls in - and you plan to use a chi-square test, how many degrees of freedom will be associated with the   statistic? df = ______________ Compute   : = ______________ Reject   when   > ______________. Conclude that there ______________ reason to expect a dependence between rows and columns. Find the approximate p-value for the test. The p-value ______________ .10 when A survey of 500 respondents produced these cell counts in a 2   3 contingency table:   If you wish to test the null hypothesis of  independence  - that the probability that a response falls in any one row is independent of the column it falls in - and you plan to use a chi-square test, how many degrees of freedom will be associated with the   statistic? df = ______________ Compute   : = ______________ Reject   when   > ______________. Conclude that there ______________ reason to expect a dependence between rows and columns. Find the approximate p-value for the test. The p-value ______________ .10 > ______________.
Conclude that there ______________ reason to expect a dependence between rows and columns.
Find the approximate p-value for the test.
The p-value ______________ .10

Correct Answer:

verifed

Verified

2; 4.1879;...

View Answer

Unlock this answer now
Get Access to more Verified Answers free of charge

Related Questions