Essay
A statistician wanted to determine if the demographic variables of age, education, and income influence the number of hours of television watched per week. A random sample of 25 adults was selected to estimate the multiple regression model:  where y is the number of hours of television watched last week, x1 is the age (in years), x2 is the number of years of education, and x3 is income (in $1,000). The computer output is shown below.
 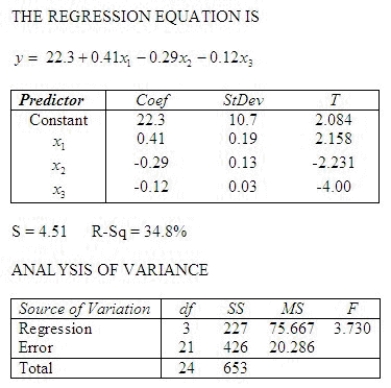 Test the overall validity of the model at the 5% significance level.
What is the test statistic?
F = ______________
______________  Conclude that the model ______________ valid at the 5% level.
Is there sufficient evidence at the 1% significance level to indicate that hours of television watched and age are linearly related?
What is test statistic?
t = ______________
______________  Conclude that there ______________ sufficient evidence at the 1% significance level to indicate that hours of television watched and age are linearly related.
Is there sufficient evidence at the 1% significance level to indicate that hours of television watched and education are negatively linearly related?
What is the test statistic?
t = ______________
______________  Conclude that there ______________ sufficient evidence at the 1% significance level to indicate that hours of television watched and education are negatively linearly related.
What is the coefficient of determination?  = ______________
Interpret this value for  :
:
________________________________________________________
Interpret  :
:
________________________________________________________
Interpret  :
:
________________________________________________________
Interpret  :
:
________________________________________________________
Correct Answer:

Verified
3.73; Reject; is; 2.158; Do not reject; ...View Answer
Unlock this answer now
Get Access to more Verified Answers free of charge
Correct Answer:
Verified
View Answer
Unlock this answer now
Get Access to more Verified Answers free of charge
Q79: In multiple regression analysis, the coefficient of
Q80: Discuss briefly what is meant by multicollinearity.
Q81: In a multiple regression analysis involving 6
Q82: Consider a multiple regression model with three
Q83: The more predictors that are added to
Q86: In multiple regression, the prediction equation <img
Q87: The test statistic F found in the
Q88: A publisher of college textbooks conducted a
Q89: In reference to the equation <img src="https://d2lvgg3v3hfg70.cloudfront.net/TB8220/.jpg"
Q214: Multiple regression is the process of using