Short Answer
A university admissions committee was interested in examining the relationship between a student's score on the SAT exam, x, and the student's grade point average, y, (GPA) at the end the student's freshman year of college. The committee selected a random sample of 25 students and recorded the SAT score and GPA at the end of the freshman year of college for each student. Use the following output that was generated using Minitab to answer the questions below: 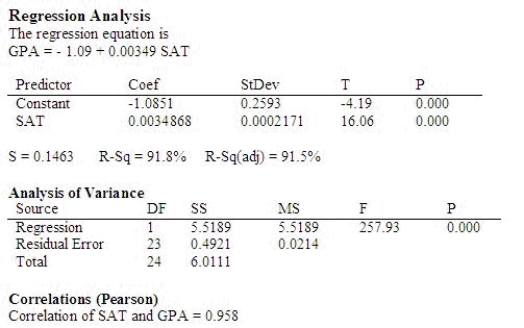 Determine the correlation between a student's SAT score and GPA at the end of the freshman year.
Since b is ______________ the correlation is ______________.
Interpret the value.
There is a ______________ linear relationship between a student's SAT score and GPA at the end of the freshman year.
Correct Answer:

Verified
positive; ...View Answer
Unlock this answer now
Get Access to more Verified Answers free of charge
Correct Answer:
Verified
View Answer
Unlock this answer now
Get Access to more Verified Answers free of charge
Q95: Simple regression analysis is a statistical technique
Q96: Given the least squares regression line <img
Q97: A stochastic relationship is a relationship between
Q98: Given that the sum of squares for
Q99: A study of 20 students showed that
Q101: The residuals are observations of the error
Q102: One way to measure the strength of
Q103: In simple linear regression, if the estimated
Q104: The prediction interval developed from a simple
Q105: If the coefficient of determination value for