Essay
A professor of economics wants to study the relationship between income (y in $1000s) and education (x in years). A random sample eight individuals is taken and the results are shown below. 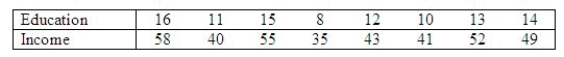 Determine the standard error of estimate.
sr = ______________
Describe what this statistic tells you about the regression line.
____________________________
Determine the coefficient of determination.
R2 = ______________
Discuss what its value tells you about the two variables.
________________________________________________________
Calculate the Pearson correlation coefficient.
r = ______________
Why does it have the sign it has?
________________________________________________________
Conduct a test of the population slope to determine at the 5% significance level whether a linear relationship exists between years of education and income.
Test statistic:
t = ______________
Rejection Region:
Reject H0 if | t | > ______________
Conclusion:
______________
A linear relationship ______________ between years of education and income.
Correct Answer:

Verified
2.436; The model's fit to these data is ...View Answer
Unlock this answer now
Get Access to more Verified Answers free of charge
Correct Answer:
Verified
View Answer
Unlock this answer now
Get Access to more Verified Answers free of charge
Q109: In simple linear regression, one can use
Q110: An indication of no linear relationship between
Q111: The sign of the correlation coefficient in
Q112: In simple linear regression, the plot of
Q113: Evidence supports using a simple linear regression
Q115: In a simple linear regression problem, if
Q116: In publishing the results of some research
Q117: The coefficient of determination <img src="https://d2lvgg3v3hfg70.cloudfront.net/TB8220/.jpg" alt="The
Q118: In a simple linear regression problem including
Q119: In a simple linear regression problem, the