Short Answer
A university admissions committee was interested in examining the relationship between a student's score on the SAT exam, x, and the student's grade point average, y, (GPA) at the end the student's freshman year of college. The committee selected a random sample of 25 students and recorded the SAT score and GPA at the end of the freshman year of college for each student. Use the following output that was generated using Minitab to answer the questions below: 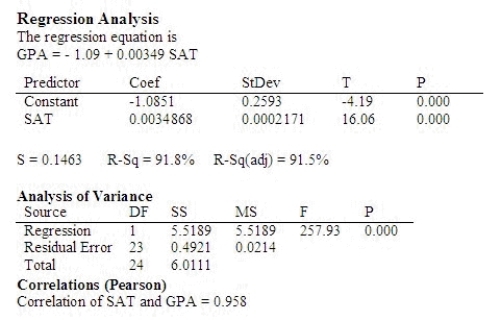 Use the printout to find the least-square prediction line.
  = ______________
Find the estimated GPA at the end of the freshman year for a student who scored 1175 on the SAT exam.
______________
What is the coefficient of determination?
______________
Interpret the coefficient of determination.
______________
Use the p-value approach to test the usefulness of the linear regression model at the 0.05 level of significance.
p-value:
______________
Conclude:
______________
There ______________ a significant linear relationship between a student's SAT score and the student's GPA at the end of the freshman year of college.
Correct Answer:

Verified
0.0035x - 1.0851; 3.0274; .918...View Answer
Unlock this answer now
Get Access to more Verified Answers free of charge
Correct Answer:
Verified
View Answer
Unlock this answer now
Get Access to more Verified Answers free of charge
Q61: A regression analysis between weight (y in
Q62: Given that <img src="https://d2lvgg3v3hfg70.cloudfront.net/TB8220/.jpg" alt="Given that
Q63: In regression analysis, a graph of each
Q64: A measure of how well an estimated
Q65: In a simple linear regression problem, the
Q67: The standard error of the estimate in
Q68: In a simple linear regression model, if
Q69: A regression analysis between weight (y in
Q70: The manager of an ice cream store
Q71: A perfect correlation between two variables will