Short Answer
Independent random samples from two normal populations produced the variances listed here: 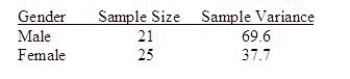 Do the data provide sufficient evidence to indicate that
  differs from
  ? Test using
  = .05.
Test Statistic = ______________
Reject Region: Reject H0 if F> ______________
Conclusion: ______________
One ______________ conclude that the variances are different.
Find the approximate p-value for the test and interpret its value.
______________ Enter (n1, n2)
Develop a 95% confidence interval for  .
.
CI = ______________ Enter (n1, n2)
Correct Answer:

Verified
1.846; 2.33; Do not ...View Answer
Unlock this answer now
Get Access to more Verified Answers free of charge
Correct Answer:
Verified
View Answer
Unlock this answer now
Get Access to more Verified Answers free of charge
Q51: If you wish to test <img src="https://d2lvgg3v3hfg70.cloudfront.net/TB8220/.jpg"
Q52: If a sample has 10 observations and
Q53: The public relations officer for a particular
Q54: Student's t-distribution is a sampling distribution for
Q55: In testing <img src="https://d2lvgg3v3hfg70.cloudfront.net/TB8220/.jpg" alt="In testing
Q57: Given a random variable that has a
Q58: A political analyst in Michigan surveys a
Q59: A random sample of 7 observations was
Q60: Which of the following correctly describes degrees
Q61: If we are testing for the difference