Short Answer
The average total SAT scores (verbal plus math) were recorded for two groups of students: one group planning to major in engineering and one group planning to major in language/literature. 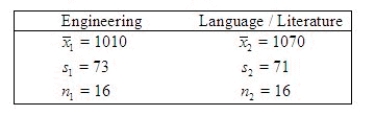 To use the two-sample t test with a pooled estimate of
  you must assume that the two population variances are equal. Test this assumption using the F test for equality of variances using
  = 0.05.
Test Statistic = ______________
Reject Region: Reject H0 if F > ______________
Conclusion: ______________
One ______________ conclude that the variances are different.
What is the approximate p-value for the test?
______________
Correct Answer:

Verified
1.057; 2.8...View Answer
Unlock this answer now
Get Access to more Verified Answers free of charge
Correct Answer:
Verified
View Answer
Unlock this answer now
Get Access to more Verified Answers free of charge
Q58: A political analyst in Michigan surveys a
Q59: A random sample of 7 observations was
Q60: Which of the following correctly describes degrees
Q61: If we are testing for the difference
Q62: What is the appropriate t critical value
Q64: The statistical distribution used for testing the
Q65: A random sample of size 9 produced
Q66: A statistician wants to test for the
Q67: It is of interest to a Harley
Q68: Assume that the population distributions of times