Short Answer
A faculty advisor was interested in determining whether there is a difference in the amount of time (in hours) spent studying on weeknights (Monday through Thursday) between male and female students. The advisor selected a sample of 12 female students and a second independent sample of 10 male students and asked each student to indicate the average amount of time they spend studying on a weeknight. The following summary statistics are obtained. 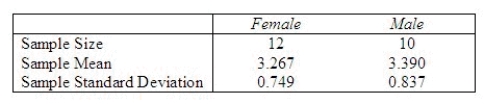 The advisor assumed equal variances in the analysis. Is this a reasonable assumption? Perform the appropriate test of hypothesis to determine whether there is a significant difference in average time spent studying on weeknights between male and female students Test using
  = 0.05.
Approximate the p-value for the test in part (c). Using the p-value approach and  = 0.10, what conclusion can be drawn about the difference in average time spent studying on weeknights between male and female students? Develop a 95% confidence interval for the average amount of time spent studying on week nights by females.
Test Statistic = ______________
Reject Region: Reject H0 if |t| > ______________
Conclusion: ______________
One ______________ conclude that there is a significant difference in average time spent studying on weeknights between male and female students.
P-value = ______________
Using the p-value approach, one ______________ conclude there is a significant difference in average time spent studying on weeknights between male and female students.
What is the 95% confidence interval? (CI)
CI = ______________ Enter (n1, n2)
Correct Answer:

Verified
-.3637; 2.086; Do no...View Answer
Unlock this answer now
Get Access to more Verified Answers free of charge
Correct Answer:
Verified
View Answer
Unlock this answer now
Get Access to more Verified Answers free of charge
Q113: The t-distribution allows the calculation of confidence
Q114: The 5<sup>th</sup> percentile of a chi-squared distribution
Q115: In constructing a confidence interval estimate for
Q116: A paired-difference experiment was conducted using 10
Q117: In testing <img src="https://d2lvgg3v3hfg70.cloudfront.net/TB8220/.jpg" alt="In testing
Q119: The "shape" of the t-distribution changes as
Q120: The F-distribution is the sampling distribution of
Q121: A random sample of size 10 produced
Q122: The sampling distribution of the ratio of
Q123: Consider the hypotheses H<sub>0</sub>: <img src="https://d2lvgg3v3hfg70.cloudfront.net/TB8220/.jpg" alt="Consider