Essay
The number of household members, x and the amount spent on groceries per week, y (rounded to the nearest dollar) are measured for eight households in the Big Rapids area. The data are shown below: 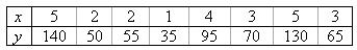 Create a raw scatterplot of these eight data points (no regression line or equation).
Find the best-fitting regression line for these data.
y = ______________
Plot the points and the best-fitting line on the same graph.
What would you estimate a household of seven to spend on groceries per week?
______________
Should you use the fitted line to estimate this amount?
______________
Why or why not?
________________________________________________________
Correct Answer:

Verified
 ;
;
0.1681 + 25.546x; ;
178.99...View Answer
Unlock this answer now
Get Access to more Verified Answers free of charge
Correct Answer:
Verified
0.1681 + 25.546x;
178.99...
View Answer
Unlock this answer now
Get Access to more Verified Answers free of charge
Q19: If the linear relationship between the dependent
Q20: When constructing a scatterplot, the independent variable
Q21: The best fitting line relating the dependent
Q22: If two variables have a correlation coefficient
Q23: If the correlation coefficient between the independent
Q25: A law school administrator was interested in
Q26: The best-fitting regression line can be used
Q27: In constructing a scatterplot, it would not
Q28: Given that <img src="https://d2lvgg3v3hfg70.cloudfront.net/TB8220/.jpg" alt="Given that
Q29: Generally speaking, if two quantitative variables are