Essay
Twenty-eight applicants interested in working for the Food Stamp program took an examination designed to measure their aptitude for social work. A stem-and-leaf plot of the 28 scores appears below, where the first column is the count per branch, the second column is the stem value, and the remaining digits are the leaves. 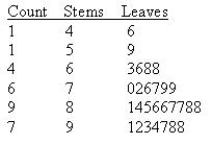 What is the value of the first quartile?
Q1 = ______________
What is the value of the third quartile?
Q3 = ______________
What is the interquartile range?
IQR = ______________
Find the inner fences.
______________
Find the outer fences.
______________
Construct a boxplot for this data.
Does the boxplot indicate the presence of any outliers?
______________
Correct Answer:

Verified
70.5; 90.25; 19.75; ...View Answer
Unlock this answer now
Get Access to more Verified Answers free of charge
Correct Answer:
Verified
View Answer
Unlock this answer now
Get Access to more Verified Answers free of charge
Q82: The mode of a data set or
Q83: From a sample of size 100, the
Q84: Any unusually large observation (as measured by
Q85: Tchebysheff's Theorem states that the percentage of
Q86: Incomes of workers in an automobile company
Q88: Which of the following statements is true
Q89: Given a distribution of measurements that is
Q90: Twenty-eight applicants interested in working for the
Q91: The expression <img src="https://d2lvgg3v3hfg70.cloudfront.net/TB8220/.jpg" alt="The expression
Q92: Consider the following set of measurements:<br>5.4, 5.9,