Short Answer
Twenty-eight applicants interested in working for the Food Stamp program took an examination designed to measure their aptitude for social work. A stem-and-leaf plot of the 28 scores appears below, where the first column is the count per branch, the second column is the stem value, and the remaining digits are the leaves. 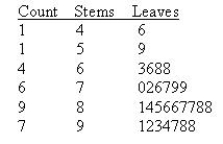
a. What is the median score?
______________
b. What is the sample mean for this data set?
______________
c. What is the value of the sample standard deviation?
______________
d. What is the range of this data?
______________
Correct Answer:

Verified
84.5; 80.6...View Answer
Unlock this answer now
Get Access to more Verified Answers free of charge
Correct Answer:
Verified
View Answer
Unlock this answer now
Get Access to more Verified Answers free of charge
Q39: The mean and variance of a sample
Q40: Given the following frequency table: <img src="https://d2lvgg3v3hfg70.cloudfront.net/TB8220/.jpg"
Q41: A sample of 600 values produced the
Q42: The left and right ends of the
Q43: If a store manager selected a sample
Q45: If the sample mean is much larger
Q46: Consider the following set of measurements: 6,
Q47: The mean of forty sales receipts is
Q48: For larger sample sizes, a rough
Q64: The standard deviation is the positive square