Essay
A neighborhood ice cream vendor would like to see if there is a relationship between day of the week and the number of children buying ice cream from her. The following data represent the number of children buying ice cream on each of the seven days of a particular week: 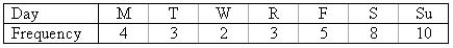
a. Construct a line chart to describe the data.
b. Is there any apparent trend in the data?
________________________________________________________
Correct Answer:

Verified
 The number of children buying...
View Answer
Unlock this answer now
Get Access to more Verified Answers free of charge
Correct Answer:
Verified
View Answer
Unlock this answer now
Get Access to more Verified Answers free of charge
Q24: Descriptive statistics deals with methods of:<br>A) organizing
Q25: Which of the following is not the
Q26: When constructing a relative frequency distribution, if
Q27: Statistical inference is the process of making
Q28: A histogram is usually used to display
Q30: A continuous quantitative variable is one that
Q31: You asked ten of your classmates about
Q32: Groupings of data, created to enhance an
Q33: A relative frequency distribution describes the proportion
Q34: A market share of 78.5 percent would