Essay
A high school volleyball coach has summarized the wins, losses, and ties of her team for the past 4 years in the following stacked bar chart. Interpret the chart. 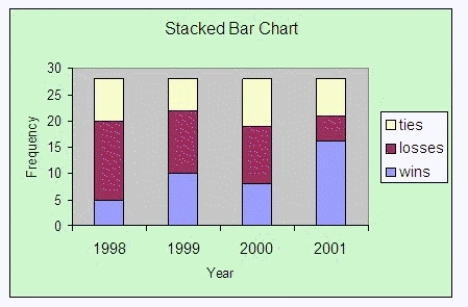
Correct Answer:

Verified
The team's best year...View Answer
Unlock this answer now
Get Access to more Verified Answers free of charge
Correct Answer:
Verified
View Answer
Unlock this answer now
Get Access to more Verified Answers free of charge
Q34: A market share of 78.5 percent would
Q35: In the term "frequency distribution," frequency refers
Q36: A hospital administration would like to know
Q37: The class interval in a frequency distribution
Q38: A common rule of thumb in constructing
Q40: The two graphical techniques we usually use
Q41: A tabular summary of categorical data set
Q42: A relative frequency distribution is a tabular
Q43: A relative frequency distribution describes the proportion
Q44: A listing of data in order of