Essay
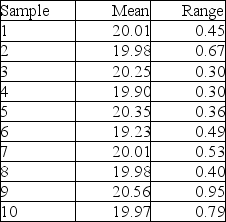
Ten samples of size four were taken from a process, and their weights measured. The sample averages and sample ranges are in the following table. Construct and plot an x-bar and R-chart using these data. Is the process in control?
Correct Answer:

Verified
 The x-bar chart is out of co...
View Answer
Unlock this answer now
Get Access to more Verified Answers free of charge
Correct Answer:
Verified
View Answer
Unlock this answer now
Get Access to more Verified Answers free of charge
Q198: Professional services typically require low levels of
Q199: What is the difference between the process
Q200: A product-focused process is commonly used to
Q201: _ is a rapid, low-cost production process
Q202: The _ is the lowest level of
Q204: Why do modern operations managers look for
Q205: _ is a method of measuring samples
Q206: A(n) _ uses symbols to analyze the
Q207: In an acceptance sampling plan developed for
Q208: Repeated sampling of a certain process shows