Not Answered
The following table shows average life expectancy in years at birth in the given year:
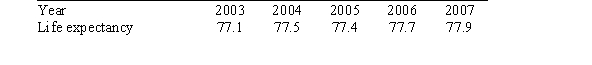 If t denotes the time in years since 2003 and E is the life expectancy in years, then the trend line for this data is given by E = 0.18t + 77.16. If this trend line persisted through 2012, what would be the average life expectancy in years of a child born in 2012?
A)78.8 years
B)79.0 years
C)78.6 years
D)79.2 years
Correct Answer:

Verified
Correct Answer:
Verified
Q19: An increase of 1 on the pH
Q20: Initially, a population is 750, and it
Q21: If the per capita growth rate of
Q22: This table shows the total number of
Q23: Cutting 7-inch-long squares from a square piece
Q25: Suppose that a music club charges $12
Q26: If the decibel of a sound is
Q27: Suppose that a rifle bullet follows a
Q28: On rural highways, the average speed S
Q29: On rural highways, the average speed S