Multiple Choice
This bar graph shows the percentage of college freshmen at ABC College needing to take a developmental math class as of the fall of the given year: 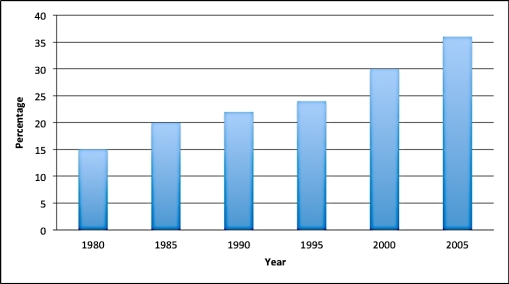 If the average yearly growth rate from 2000 to 2005 is 1.2%, estimate the percentage of college freshmen at ABC College needing to take a developmental math class in 2008.
A) 36.7%
B) 40.8%
C) 38.4%
D) 39.6%
Correct Answer:

Verified
Correct Answer:
Verified
Q21: It is not important to know whether
Q22: In 1949, the inflation rate in the
Q23: As we grow up, we get taller.
Q24: The following table shows the world population
Q25: According to a report, the percentage of
Q27: The inflation rate from 2001 to 2007
Q28: From 1970 to 2010, the inflation rate
Q29: The following table shows the number of
Q30: A rising line graph indicates a _
Q31: The inflation rate from 1980 to 2010