Multiple Choice
The following bar graph shows the annual attendance at a state fair: 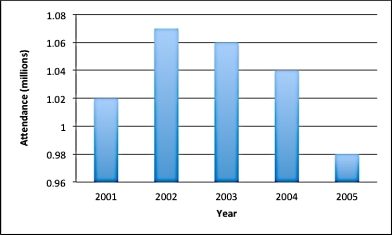 The chart seems to show a sharp decrease in attendance from 2004 to 2005. Calculate the percentage change from 2004 to 2005.
A) 30%
B) 20%
C) 6%
D) 3%
Correct Answer:

Verified
Correct Answer:
Verified
Related Questions
Q31: The inflation rate from 1980 to 2010
Q32: If inflation from year 1 to year
Q33: A company's number of sales each year
Q34: In cleaning toxic waste sites, typically the
Q35: Which of the following descriptions of a
Q37: Suppose we have some money in a
Q38: The following table shows the world population
Q39: When in doubt, where should we go
Q40: The average growth rate of a function
Q41: If inflation from year 1 to year