Multiple Choice
The Venn diagram shows the results of a survey asking registered voters if they would vote for proposition A or proposition B: 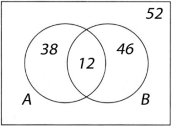 How many surveyed would NOT vote for proposition A?
A) 46
B) 52
C) 98
D) 58
Correct Answer:

Verified
Correct Answer:
Verified
Q35: A group of students were surveyed to
Q36: A group of students were surveyed to
Q37: Find a logically equivalent statement of If
Q38: Choose a valid conclusion based on the
Q39: He shouldn't be trusted because he is
Q41: Suppose you wanted to line up all
Q42: If a car drives 11 kilometers per
Q43: Write the given set as a list
Q44: The inverse is logically equivalent to the:<br>A)conditional.<br>B)contrapositive.<br>C)converse.<br>D)conjunction.
Q45: The inverse of the statement If<img src="https://d2lvgg3v3hfg70.cloudfront.net/TB8424/.jpg"