Multiple Choice
The Venn diagram shows the results of a survey asking registered voters if they would vote for proposition A or proposition B: 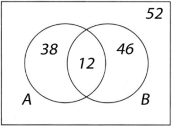 To get approved, a proposition must get at least 40% of the total votes. List the approved propositions.
A) None
B) A
C) B
D) A and B
Correct Answer:

Verified
Correct Answer:
Verified
Related Questions
Q49: Suppose set M is mathematics majors and
Q50: In a recent hiring period, XYZ Corporation
Q51: Use inductive reasoning to determine the next
Q52: You are going on a 957-mile trip
Q53: Light travels at 186,000 miles per second.
Q55: For charity, a school collects 10 million
Q56: The _ type of informal fallacy simply
Q57: The following is a valid argument: All
Q58: Determine whether the given statement is true
Q59: Two statements are logically _ if they