Multiple Choice
The following graph of time-series data suggests a ___ trend. 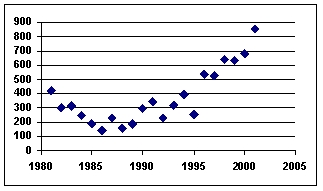
A) linear
B) quadratic
C) cosine
D) tangential
E) flat
Correct Answer:

Verified
Correct Answer:
Verified
Related Questions
Q44: Autoregression is a multiple regression technique in
Q59: Using a three-month moving average, the forecast
Q61: A stationary time-series data has only trend,
Q61: Jim Royo, manager of Billings Building
Q62: Using a three-month moving average, the forecast
Q67: The long-term general direction of data is
Q68: A time series with forecast values is
Q75: The motivation for using an index number
Q84: Weighted aggregate price indexes are also known
Q96: Typically, the denominator used to calculate an