Multiple Choice
The following graph of a time-series data suggests a ___ trend. 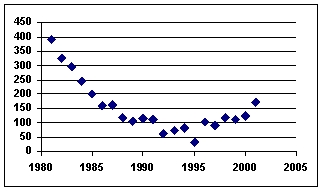
A) linear
B) tangential
C) cosine
D) quadratic
E) flat
Correct Answer:

Verified
Correct Answer:
Verified
Related Questions
Q46: Which of the following is not a
Q47: Using a three-month moving average (with weights
Q48: Fitting a linear trend to 36 monthly
Q50: A time series with forecast values and
Q52: Using a three-month moving average, the forecast
Q53: A time series with forecast values and
Q54: The forecast value for August was
Q56: What is the forecast for the Period
Q63: Two popular general categories of smoothing techniques
Q95: Autocorrelation in a regression forecasting model can