Multiple Choice
The following graph of a time-series data suggests a ___ trend. 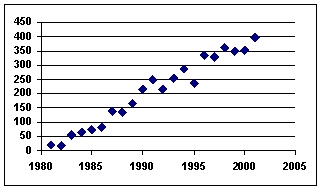
A) linear
B) quadratic
C) cosine
D) tangential
E) flat
Correct Answer:

Verified
Correct Answer:
Verified
Related Questions
Q3: Analysis of data for an autoregressive forecasting
Q6: The ratios of "actuals to moving averages"
Q7: Using 2019 as the base year, the
Q9: The following graph of time-series data suggests
Q10: Using a three-month moving average (with weights
Q11: Fitting a linear trend to 36 monthly
Q46: Use of a smoothing constant value less
Q71: Use of a smoothing constant value greater
Q72: In exponential smoothing models, the value of
Q81: Two popular general categories of smoothing techniques