Multiple Choice
The following scatter plot indicates that ___. 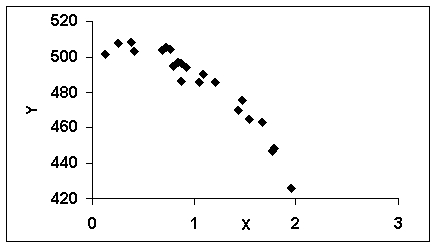
A) a log x transform may be useful
B) a log y transform may be useful
C) an x2 transform may be useful
D) no transform is needed
E) a (- x) transform may be useful
Correct Answer:

Verified
Correct Answer:
Verified
Related Questions
Q2: Abby Ross, a market specialist at the
Q4: An acceptable method of managing multicollinearity in
Q6: Qualitative data cannot be incorporated into linear
Q8: A multiple regression analysis produced the following
Q9: A multiple regression analysis produced the
Q11: Hope Williams, Marketing Manager of RightAid Pharmacy,
Q12: A multiple regression analysis produced the
Q28: A logarithmic transformation may be applied to
Q46: In multiple regression analysis, qualitative variables are
Q50: The regression model y =