Multiple Choice
The following graph is a binomial distribution with n = 6: 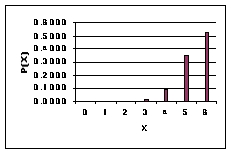 This graph reveals that ___.
A) p > 0.5
B) p = 1.0
C) p = 0
D) p < 0.5
E) p = 1.5
Correct Answer:

Verified
Correct Answer:
Verified
Related Questions
Q21: The following graph is a binomial distribution
Q23: Poisson distribution describes the occurrence of discrete
Q25: The number of phone calls arriving at
Q27: The number of automobiles sold by a
Q28: To compute the variance of a discrete
Q28: Suppose a committee of 3 people is
Q30: You are offered an investment opportunity.Its outcomes
Q36: Ten policyholders file claims with CareFree Insurance.Three
Q73: As in a binomial distribution, each trial
Q82: For the Poisson distribution the mean and