Multiple Choice
A shirt production company has tracked their production since the company started in 1999.The graph of their annual production is shown. 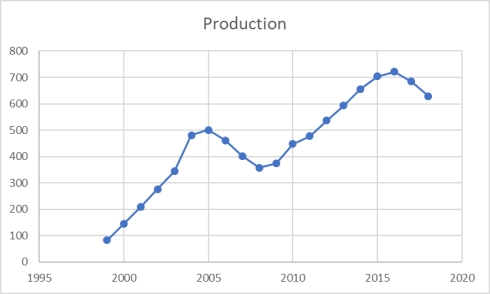 During these years, production has generally _______________.
A) increased in these years.
B) declined in most of the years shown.
C) increased in every year since 1999.
D) decreased in most of those years.
E) increased and declined without a discernable trend.
Correct Answer:

Verified
Correct Answer:
Verified
Q1: The following represent the ages of students
Q2: A cross tabulation is a graph that
Q45: One rule that must always be followed
Q60: Consider the following stem and leaf
Q67: To compare two series of data during
Q75: Consider the following frequency distribution:
Q83: The staff of Mr.Wayne Wertz, VP of
Q86: Consider the following stem and leaf plot:
Q90: A person has decided to construct a
Q110: Consider the relative frequency distribution given