Multiple Choice
A shirt production company has tracked their production and expenses since the company started in 1999.The graph of both is shown. 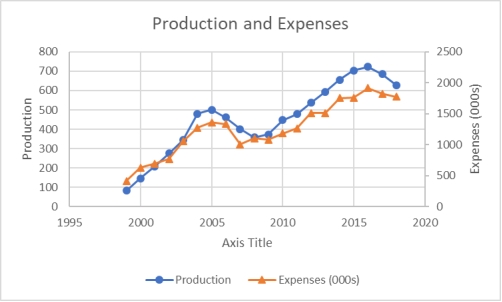 When comparing production and expenses during these years, what conclusion is not true?
A) Both series are generally decreasing.
B) Both series are generally increasing.
C) The time from 2005 to 2008 indicates a downward trend for both
D) The time from 2008 to 2018 indicates an upward trend for both
E) Expenses and production appear to follow similar trends
Correct Answer:

Verified
Correct Answer:
Verified
Q19: A histogram can be described as a
Q48: A scatter plot is a two-dimensional graph
Q48: The staff of Mr.Wayne Wertz, VP of
Q49: Each day, the office staff at Oasis
Q55: The staff of Mr.Wayne Wertz, VP of
Q57: Consider the following frequency distribution:
Q58: The staff of Ms.Tamara Hill, VP of
Q87: The staffs of the accounting and the
Q107: Consider the following frequency distribution:
Q108: A graphical representation of a frequency distribution